Tuesday, 29 January 2019

Why to Compensate Reactive Power ? & Control & Regulations of Reactive Power

There are many simultaneously active loads in a conventional electricity network. Many are resistive, some have a capacitive component, i.e. the current curve hurries a bit ahead of the voltage curve (leading), and others have an inductive component, i.e. the current lags behind the applied voltage (for a more detailed explanation, see Annex on inductances, capacitances and reactive power).Resistive-inductive loads prevail in most networks, resulting in a resistive-inductive overall current. This incessant, undesired, oscillation of energy means an additional flow of current in cables and transformers. It causes additional resistive-losses and uses a potentially large part of their capacity.
Therefore the basic reasons for compensating are to avoid: 
  • The undesired demand on transmission capacity (additional current)
  • The energy losses caused by such
  • The additional voltage drops caused by such 

These extra voltage drops in the system are significant; a reactive current flowing in a resistance causes a real power loss. Even where the impedance is largely reactive, rapid changes in the reactive current  may cause flicker. A good example of this is a construction crane connected to a relatively small distribution transformer when a new home is erected in a residential area. The cranes are usually driven by relay-controlled three-phase induction motors which are quite frequently switched from stop to start, from slow to fast, and from downwards to upwards. 

The start-up currents of these motors are very high, several times the rated current, and have a very high inductive component, the power factor being around cos ϕ ≈ 0.3 (or even smaller with bigger machines). The voltage drop in the transformer is also largely inductive, so it has more or less the same phase angle as the start-up current of the motor. It will  add much more to the flicker than the same current drawn by a resistive load (Figure 1). Fortunately, this also means that this flicker can easily be mitigated by adding a capacitor to compensate the inductive component of the motor’s start-up current.  
CONTROL AND REGULATION OF REACTIVE POWER 
It is normally desirable to compensate reactive power. This is quite easy to achieve by adding an appropriate capacitive load parallel with the resistive-inductive loads so that the inductive component is offset. While the capacitive element is feeding its stored energy back into the mains,the inductive component is drawing it, and vice versa, because the leading and the lagging currents flow in opposite directions at any point in time. In this way, the overall current is reduced by adding  a load. This is called parallel compensation. 

To do this properly requires knowledge of how much inductive load there is in the installation, otherwise over-compensation may occur. In that case, the installation would become a resistive capacitive load which in extreme cases could be worse than having no compensation at all. If the load –more precisely its inductive component – varies, then a variable compensator is required. Normally this is achieved by grouping the capacitors and switching them on and off group-wise via relays. 

This of course causes current peaks with the consequent wear of the contacts, risk of contact welding and induced voltages in paralleled data lines. Care must be taken in timing the switch on. When voltage is applied to a fully discharged capacitor at the instance of line voltage peak, the inrush current peak is equal to that of a short circuit. Even worse, switching on a short time after switching off, the capacitor may be nearly fully charged with the inverse polarity, causing an inrush current peak nearly twice as high as the plant’s short circuit current peak! If there are many switch-mode power supply loads (SMPS) being operated on the same system, then a charged compensation capacitor, reconnected to the supply, may feed directly into a large number of discharged smoothing capacitors, more or less directly from capacitance to capacitance with hardly any impedance in between. The resulting current peak is extremely short but extremely high, much higher than in a short circuit! 

There are frequent reports about the failure of devices, especially the contacts of the relays controlling the capacitor groups, due to short interruptions in the grid which are carried out automatically, e.g. by auto-reclosers, to extinguish a light arc on a high or medium voltage overhead line. It is often suggested that this doubling of peak value cannot occur with capacitors that are equipped with discharge resistors in accordance with IEC 831. However, the standard requires that the voltage decays to less than 75 V after 3 minutes, so they have little effect during an interruption as short as a few tens of milliseconds up to a few seconds. If, at the instant of re-connecting the capacitor to the line voltage, the residual capacitor voltage happens to equal the supply voltage, no current peak occurs. At least this is true if the compensator is viewed as a pure capacitance and the incoming voltage as an ideal voltage source, i.e with zero source impedance. But if the self-inductance of the system is taken into account, certain resonances between that and the capacitance may occur. 

Assume the following case: the residual voltage of the  capacitor is half the peak value and equal to the instantaneous line voltage, which is at 45° after the last zero voltage crossing, i.e. 


At this point in time the current in the capacitor is expected to be: 


However, this is not the case, because the capacitor has been disconnected from the supply up to this point in time. At the instant of connection, neglecting the system’s inductance, the current would rise up to this value immediately, and nothing would happen that would not have happened anyway in the steady state. But a real system is not free of inductance, so the current will assume
this value only hesitantly at first, then speed up and – again due to the inductance, its ‘inertia’ – shoot beyond the target way up to nearly double the expected value. Then it will come down again and so on, and thus perform a short period of oscillation that may be attenuated down to zero well within the first mains cycle after connection. The frequency of such oscillation may be rather high, since the mains inductance is low, and may cause interference to equipment in the installation. Only if the instantaneous line and residual capacitor voltages are both at their positive or negative peaks at the instant of re-connecting the capacitor, at which point in time the instantaneous current
would be zero anyway, will the resistive-inductive current start without oscillation. 

More precisely, there are two conditions to be fulfilled. Firstly, the sum of voltages across the capacitance and its serial reactance (be it parasitic or intentional detuning) must be equal to the line voltage. Secondly, the supposed instantaneous current, assuming connection had already taken place long before, has to equal the actual current, which of course is zero until the instant of switching. This second condition is fulfilled only at line voltage peak, which therefore has to equal the capacitor voltage. To achieve this, the capacitor is pre-charged from a supplementary power source. This practice has a  secondary minor advantage in that it makes sure that there is always the maximum possible amount of energy stored in the capacitor while not in use, so that at the instant of turn-on it may help to mitigate some fast voltage dip and prevent the subsequent flicker. 

Relays, however, are too slow and do not operate precisely enough for targeted switching at a certain point of the wave. When relays are used, measures have to be taken to attenuate the inrush current peak, such as inrush limiting resistors or detuning reactors. The latter are frequently used anyway for other reasons, and are sometimes required by utilities. Although this series reactor
replaces the inrush current peak at switch-on with a voltage peak (surge) at switch-off, it is still the lesser evil, since the reactive power rating of the reactor is just a fraction of the capacitor rating and so the energy available is less. 

Electronic switches, such as thyristors, can be easily controlled to achieve accurate point-on-wave switching. It is also possible to control switching so as to mitigate a fast flicker caused by a large unstable inductive load, such as the crane motor mentioned previously, an arc furnace or a spot welder. 

Now the latest solution is Emerich Energy's Premium product An advanced IGBT based one "Active Var Generator" (AVG) Which is Maintenance Free and Precise Compensation.

For Advanced Power  Quality Study & Completely Automated Report:  

Connect with Emerich Energy 
Please write to us info@emerich.in 
Call: 044-48577667

Please follow our blog or LinkedIn Page. https://www.linkedin.com/company/emerichenergy/

Monday, 28 January 2019

What Is Power Quality? Whose Responsibility is it?

Power Quality
Electric power quality, or simply power quality, involves voltage, frequency, and waveform. Good power quality can be defined as a steady supply voltage that stays within the prescribed range, steady a.c. frequency close to the rated value, and smooth voltage curve waveform (resembles a sine wave). In general, it is useful to consider power quality as the compatibility between what comes out of an electric outlet and the load that is plugged into it.
India and most developing countries continue to struggle for 24×7 power supply, good Power Quality (PQ)environment, and Energy Efficient (EE) economy.
WHO IS RESPONSIBLE FOR MAINTAINING GOOD POWER QUALITY?
Answer to this is usually divided and depends upon whom we pose this question. Network Operator will blame his end-customers, Device Manufacturer will blame both the Network Operator and the end-customer, and end-customer usually has not much awareness, and believe that its supply problem from Network Operator.
In addition to above 3 key stakeholders, there are others like – Designers, Commissioning Engineers and Maintenance Engineers that also plays role in sustaining good PQ environment.Commissioning Engineer play the role in ensuring the quality of installation based on certain design standards. Good installation is one of the necessities to maintain power quality during operations and to minimize voltage drop, sparking, overheating, etc. Maintenance engineers are subsequently responsible for preventing any glitches in operations which can result in power quality issue. For ex. loose connections lead to sparking;poor quality of wires results in voltage drops at customers premise, etc.
Further on, we shall focus upon 3 key stakeholders – Customers, Network Operators and Equipment Manufacturers.

INTER-CONTENTEDNESS OF OUR GRID AND POWER QUALITY 

Power Quality is a measure of quality of power supply on the grid. A PQ disturbance occurs in case of any deviation of voltage and current wave forms from the ideal. Voltage disturbances commonly originate in the network and affect the customers. On the other hand, current disturbances originate at a customers installation and affect the network components and other installations. Therefore, VOLTAGE QUALITY is considered to be primary responsibility of the network operator, while CURRENT QUALITY is primary responsibility of the end-customers.
Because of interconnected grid, PQ disturbances are caused both by upstream and downstream elements. Across various PQ disturbances

CUSTOMERS AND PQ INTERCONNECTION

Today’s customers are highly dependent on digital technology and power electronic devices, with increasing use of various types of electronic appliances, ballasts, variable speed drives, etc. These devices when used produce current distortions in the network due to their non-linear operating characteristics. These disturbances then travel upstream because of insufficient isolation of each customers from the grid. This increase current in turn causes additional energy losses in the system and also pose increased demand of apparent power to individual customer and also entire network faces the risk of premature aging and failure.
Some of commonly reported PQ complaints from end-customers:

Equipments affected by poor PQExternal Manifestation of poor PQElectrical Manifestation of poor PQ
IT equipmentsComputer lock-ups and data lossPresence of earth leakage current causing small voltage drops in earth conductors
Variable speed drives, telecom equipments, arc furnace, welding equipment, relays, static converters, security and access control systems, etc.Motors and drives malfunctioning, computer screen freeze, loss of dataCapacitor bank failure, shocks due to neutral voltage, Flickering of lights, noise in telecom lines
Motors and process devicesMalfunctioning of motors and process devices. Extra heating, decreased operational efficiency and premature aging of the equipment.Presence of voltage and current harmonics in the power supply
Relays, circuit breakers and contactorsNuisance tripping of protective devicesDistorted voltage waveform because of voltage dip
Sensitive measurements of process control equipmentLoss of synchronization in processing equipmentSevere harmonic distortion creating additional zero-crossings within a cycle of the sine wave
Table 1. Customers reported problem due to poor PQ Environment (Source: 2. Sharmistha Bhattacharyya and Sjef Cobben, Technical University of Eindhoven)
With increased awareness, Customers can take below precautions to support building healthy PQ environment:
  • Maintain power factor within prescribed limits to reduce reactive power demand, which in turn will balance the voltage in their premise and also overall network
  • Reduce harmonic currents while using more energy efficient equipments at their premise
  • Keep a log of faced power disturbances at premises, which may come handy in finding effective solutions

‘NETWORK OPERATORS’ AND PQ INTERCONNECTION

The Network Operators design and maintain key network characteristics like feeder length, number and sizing of Distribution Transformers (DT), DT load balancing etc. which in turn determine grid impedance and that influence the PQ level in the network. With high impedance in the network, PQ issues (mainly flicker and harmonics) become more prominent. Further, DT winding configurations and earthing problems also add to the harmonic behavior and voltage dips in the network. 
Thus, technical Loss reduction and fixing PQ environment are strongly interrelated, and could be addressed though same investments. The main network components which get affected in terms of faster wear and tear through PQ disturbances are:

  • Transformers
  • Cables
  • Power-factor correction (PFC) Capacitors
  • Protective Devices, Digital Relays
  • Revenue Meters
The Network Operator can streamline its loss reduction initiatives with improving PQ environment in following ways:
  • Controlling voltage level at customers point of connection by reactive power management and take appropriate steps at the broader network level.
  • Maintaining load balance at Feeder and DT level, and reduce current losses. This will ensure increased power availability.
  • Doing regular PQ Measurements with advancement in technologies like SCADA, Smart Metering, etc. and designing relevant dashboards to facilitate timely actions
  • Isolating customer loads and their variations from main grid through use of Capacitor banking. Different variants like automatic power factor correcting devices, switched capacitors, Statics VAR compensators, dynamic voltage regulators etc. are available.

EQUIPMENT MANUFACTURERS’ AND PQ INTERCONNECTION

Organized and branded Equipment Manufacturers usually specify PQ immunity (EMI/EMC) of their equipment in terms of harmonic current emission and other parameters, as applicable under some Standards. However, in a real life situation, the network voltage is already distorted (and is non-sinusoidal) because of harmonic current emissions from other loads and customers in the network. This can result into distortions from their devices exceeding the ‘compatibility level’ of the system.
The optimum performance of Equipment Manufacturers’ device is not guaranteed when the supply voltage is distorted. Experiments show that devices produce higher harmonic currents when the supply voltage is distorted. Below table compares total harmonic current distortions (THD) of some households’ devices under sinusoidal and distorted supply voltage condition.

Device
THD with respect to the total RMS current drawn by the device
Under clean voltage condition
Under distorted voltage condition (THD = 6%)
TV
48%
55%
Personal Computer (PC)
87%
89%
Refrigerator
10%
18%
CFL
72%
79%
Table2. THD of devices under clean and distorted network voltage conditions (Source: 2. Sharmistha Bhattacharyya and Sjef Cobben, Technical University of Eindhoven)
The device manufacturer, however, cannot be blamed directly for such a situation as he is not responsible for his devices’ operations under a distorted supply voltage condition. But at the same time the manufacturers also need to ensure the immunity of equipments they manufacture against Electro Magnetic Interference (EMI) and specify the tolerance limits for same.
Question is should Manufacturer built in this isolation into its equipments, with resulting price hike, or should customer take collective facility isolation from main grid interference? While answer to this will be driven by market and regulations, still Manufacturers together with their installation teams could start giving weight to PQ issues during their installations and checking some basics like – capacitor bank, cables with larger neutral conductors, adjusting under voltage relays, etc.

CO-CREATING AN ECOSYSTEM FOR BETTER PQ MANAGEMENT

As we saw, poor PQ environment is caused by Customers, Network Operators and also Equipment Manufacturers. At the same time, poor PQ impacts all of them negatively – Network Operator has to face high losses, customers has to face increased break-down of equipments and higher bills, and Equipment Manufacturers has to face increased warranty costs. Therefore, to implement PQ mitigation, a systematic approach needs to be followed starting with to identify the responsibilities of each stakeholder in the network. 
With growing complexities both on the on end-customer side (via increasing usage of electronic appliances) and Network Operator side (via higher adoption of smart grids, smart meters etc), it is important that each stakeholders understand their contribution and impact from PQ, and take appropriate measures. End-Customers have to become more aware and demanding in their procurements of both power and also equipments, as at the end, it is them who pays out for these in-efficiencies. In US and Europe, there are clear SLAs for voltage supply and harmonics emission at the point of supply between the Network Operator and end-customers. Improved Regulation, policies, standards and end-customer awareness and reinforcement will play key role in guiding market for optimum equilibrium for good PQ environment.


Source: A web Article from APQI

Productive Advantages of Power Factor Correction

Power Factor Penalties? Monthly Money Lost?

Power supply authorities apply a tariff system which imposes penalties on the drawing of energy with a monthly average power factor lower than 0.9.
The contracts applied are different from country to country and can vary also according to the typology of costumer: as a consequence, the following remarks are to be considered as a mere didactic and indicative information aimed at showing the economic saving which can be obtained thanks to the power factor correction.
Generally speaking, the power supply contractual clauses require the payment of the absorbed reactive energy when the power factor is included in the range from 0.7 and 0.9, whereas nothing is due if it is higher than 0.9. For cosϕ < 0.7 power supply authorities can oblige consumers to carry out power factor correction.
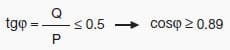
It is to be noted that having a monthly average power factor higher than or equal to 0.9 means requesting from the network a reactive energy lower than or equal to 50% of the active energy:
Economic advantages of power factor correction
Therefore no penalties are applied if the requirements for reactive energy do not exceed 50% of the active one.
The cost that the consumer bears on a yearly base when drawing a reactive energy exceeding that corresponding to a power factor equal to 0.9 can be expressed by the following relation:


where:
  • CEQ is the cost of the reactive energy per year in €;
  • EQ is the reactive energy consumed per year in kvarh;
  • EP is the active energy consumed per year in kWh;
  • EQ – 0.5 · Ep is the amount of reactive energy to be paid;
  • c is the unit cost of the reactive energy in €/kvarh.
If the power factor is corrected at 0.9 not to pay the consumption of reactive energy, the cost of the capacitor bank and of the relevant installation will be:


where:
  • CQc is the yearly cost in € to get a power factor equal to 0.9;
  • Qc is the power of the capacitor bank necessary to have a cosϕ of 0.9, in kvar;
  • cc is the yearly installation cost of the capacitor bank in €/kvar.
The saving for the consumer shall be:


It is necessary to note that the capacitor bank represents an “installation cost” to be divided suitably for the years of life of the installation itself applying one or more economic coefficients; in the practice, the savings obtained by correcting the power factor allow the payback of the installation cost of the capacitor bank within the first years of use.
As a matter of fact, an accurate Emerich Power Quality analysis of an investment implies the use of some economic parameters that go beyond the purposes of this article.
FOR POWER QUALITY STUDY & AUTOMATED REPORT:  Connect with Emerich Energy 
Please write to us info@emerich.in Call: 044-48577667

Please follow our blog or LinkedIn Page.  

Monday, 21 January 2019

Methodology for PF computation and Penalty and Incentive

In view of MERC Tariff order 195 of 2017 dt. 12.09.2018, Penalty for leading Power Factor is introduced,whereas incentive is applicable in case of lag PF only.

Penalty for leading power factor also introduced. This penalty will be applicable from prospective effect. As a first step towards the kVAh billing system, which is devoid of any separate incentive / penalty for power factor, the Commission has decided to reduce the existing PF Incentive/ Penalty by 50%. 

Accordingly, maximum PF Incentive, which is 7% at the Unity Power Factor, has been reduced to 3.5%. Similarly, Penalty for the lower power factor has been penalized.

Whenever the avg P.F. is more than 0.95 Lag and upto 1, an incentive shall be given at the rate of percentage in Tariff order at the amount of monthly electricity bill, excluding taxes and duties. And whenever average P.F. is less than 0.9 (Lead or Lag), Penal Charges shall be levied at the rate of percentage of amount of monthly electricity bill, excluding taxes and duties. 

Following Methodology for PF computation and Penalty and Incentive w.e.f. Sep-2018: 


i. If PF Level is less than 0.90 then penalty shall be as per percentage given in MERC order.

ii. If PF Level is greater than 0.95 and RKHAV Lag consumption >= RKVAH Lead consumption then incentive shall be as per percentage given in MERC order.

iii. If PF Level is greater than 0.95 and RKHAV Lag consumption < RKVAH Lead consumption then incentive shall not be applicable.

iv. If the RKVAH Lead reading is not available then old procedure of PF computation

FOR POWER QUALITY STUDY & AUTOMATED REPORT:  Connect with Emerich Energy 
Please write to us info@emerich.in Call: 044-48577667

Please follow our blog or LinkedIn Page.  

Power Factor Incentive/Penalty: Revision in Maharashtra Electricity Tariff


The Maharashtra Electricity Regulatory Commission, in exercise of its power under Sections 61 and 62 of the Electricity Act (EA), 2003, and in pursuance  of the MYT Regulations and all other  powers enabling it in the behalf,  and  after  taking into consideration  MSEDCL’s  submission, the  written  and  oral suggestions  and objections received and the  responses  of MSEDCL, and all other  relevant  material,  has issued Mid-Term Review Order dated 12 September, 2018 in Case No. 195 of 2017.


Accordingly, the guidelines as under are issued for replacement  of the said order of the commission without prejudice to the rights of MSEDCL to take any actions as provides in the law.

Power Factor Incentive/Penalty:

In view of MERC Tariff order 195 of 2017 dt. 12.09.2018, Penalty for leading Power Factor is introduced, whereas incentive is applicable in case of lag PF only.

Penalty for leading power factor also introduced. This penalty will be applicable from prospective effect. As a first step  towards  the  kVAh billing system, which is devoid of any separate  incentive / penalty for power factor,  the  Commission has  decided  to  reduce  the  existing PF Incentive/ Penalty  by 50%. Accordingly, maximum PF Incentive, which is 7% at the Unity Power Factor, has been reduced to 3.5%. Similarly, Penalty for the lower power factor has been penalized.

Whenever the avg P.F. is more than 0.95 Lag and upto 1, an incentive shall be given at the rate of percentage in Tariff order at the amount  of monthly electricity bill, excluding taxes and duties. And whenever average P.F. is less  than  0.9 (Lead or Lag), Penal Charges shall be levied at the  rate  of percentage  of amount  of monthly electricity bill, excluding taxes and duties.

There is change in % of PF Penalty and Incentive as below. 


FOR POWER QUALITY STUDY & AUTOMATED REPORT:  Connect with Emerich Energy 
Please write to us info@emerich.in Call: 044-48577667

Next post about Methodology for PF computation and Penalty and Incentive. Please follow our blog or LinkedIn Page.  


Wednesday, 9 January 2019

Power Quality Issues in Healthcare Industry (Case Study)


The healthcare environment comprises of various combination of sensitive electronic loads and other commercial loads. Hence maintaining quality power is essential and critical.As the medical devices are sensitive, poor quality power affects their performance. Electrical disturbances will lead to lock up of the devices. Power quality problems may arise due to non-linear loads, injection of harmonics, and interaction between medical equipment. Common sources of power quality problems found in hospitals . Since power quality problems are cumulative; power quality events (detectable in an audit) can lead to loss-of-life and eventually premature equipment failure. An attempt was made to identify the power quality levels to assess the quality of service received from the utility and locates the areas within the hospital where problems arising from instability exists or may develop in the near future.


The hospital under study has the following types of power supply. 
Normal Supply (NS) is a direct utility supply (HESCOM) for non-essential areas. 
Essential Supply (ES) is used for areas of medical importance that are not critical to patients in the case of supply interruption. 


The essential supply is backed up by an emergency generator. 
Uninterruptible Power Supply (UPS)/stabilizers is used for operating theaters, patient monitoring and other equipment that is important to the well being and safety of patients. The hospital complex under study has incoming supply of 11kV from the utility. Transformer with Δ-Υ connection and solidly grounded is used to buck the voltage to 440 volts. The critical medical loads are: X-ray, CT, MRI, ICUs, operation theaters which contains surgical suits etc.

Case study 


The methodology employed was taking the measurements of voltage, current, % voltage THD, % current THD at few medical load points and other miscellaneous loads using an Energy audit kit (Fluke) at Reputed College of Medical Sciences & Hospital, Chennai, The data obtained were compared against the IEEE 519 standards for analysis. 


X-ray Here X-ray equipment is fed from essential three phase supply. But no stabilizer is employed. X-ray circuit consists of primary and secondary sections. Primary will get normal three phase supply and the secondary will step up the voltage in terms of kV which will inturn builds up the capacitor to charge when the circuit is closed (when exposure button is pushed) . When pre-selected charge is reached, the capacitor completes the circuit & sends the charge to the x-ray tube. The voltage THD was found to be 5.2%, which is more than IEEE 519 standard.


Computed tomography (CT) CT scan uses powerful x-ray technology that circles the body as the patient, lying on a moving, flat table, passes through a very shallow tunnel, commonly referred to as the donut. The fast moving parts of the x-ray source and detectors are within the donut and out of sight. As the Xray assembly rotates around the patient's body, the scanner produces images in thin slices which a computer reconstructs into sharp, three-dimensional (3D) images of the scanned body part. CT is fed from UPS in this hospital. The THD for current under operating condition was 6.01%, voltage THD was found to be within limits.


MRI (Magnetic Resonance Imaging) An MRI (or magnetic resonance imaging) scan is a radiology technique that uses magnetism, radio waves, and a computer to produce images of body structures. The MRI scanner is a tube surrounded by a giant circular magnet. The patient is placed on a movable bed that is inserted into the magnet. The magnet creates a strong magnetic field that aligns the protons of hydrogen atoms, which are then exposed to a beam of radio waves. This spins the various protons of the body, and they produce a faint signal that is detected by the receiver portion of the MRI scanner. The receiver information is processed by a computer, and an image is produced. MRI is fed from UPS in this hospital. A phantom bottle assy and a head coil was used as a simulator instead of patient. The voltage THD was found to be closer to the

limits, but the current THD was 7.9%, and was more than current distortion limit for the system’s ISC/IL ratio. The ratio is 20 for this system.

Cathlab Cardiac Catheterization is a complex medical procedure that is used to diagnose and treat a wide variety of heart conditions. During cardiac catheterization, a narrow tube called a catheter is inserted into the femoral artery near the groin with a plastic introducer sheath. The catheter is guided through the blood vessel to the coronary arteries with the aid of an x-ray. The procedure is performed by a cardiologist in a specially equipped room know as a Catheterization laboratory (cath lab). The most used cathlab equipment consists of an x-ray generator, contrast, and catheters  The CATHLAB was fed from UPS. The voltage THD was found to be 4%, which is exceeding the standards prescribed for hospital premises. 

Surgical suits The supply to the surgical suits was highly distorted. Both current and voltage distortion were beyond limits. Another observation was found to be of unbalance in three phases. This results in neutral current to flow back to the transformer. 

Other loads These loads consisted of pharmacy, administration blocks, store, lift panel, supply to surgery OPD. This implies that load is of mixed type. Lot of current harmonic distortion was observed along with unbalanced load current. The neutral current was high. At the main panel also, current distortion was found to be 7%. 

Observations The analysis of the system highlighted some aspects. They were high THD a unbalanced load currents. These both contribute to high neutral current which will flow back to transformer neutral resulting in excess heating of the neutral cable. As the THD increases, the neutral current also increases 


FOR POWER QUALITY STUDY & AUTOMATED REPORT:  
Connect with Emerich Energy Please write to us info@emerich.in Call: 044-48577667